At Contify, listening to our customers’ feedback has been central to our product strategy. We are committed to improving your product experience through continuous innovation.
This month, we are excited to roll out PDF reading capabilities in Copilot, consolidated summary from multiple updates in Newsfeeds, and more, all built to streamline and enhance your M&CI workflow significantly.
Let’s get right into it.
The main highlights in this edition include:
- New in Copilot: Ask questions from your PDFs
- New in Newsfeeds: Consolidated summary from multiple updates
- New in Dashboard Widgets: Bubble & Region coverage chart types
- Insights update: Enhanced reference management
- Newsfeeds update: Open access to Key Highlights and Quotes
New in Copilot: Ask questions from your PDFs
Now, you can upload your PDFs on Contify Copilot and ask questions based on their content. Copilot will provide answers using the information from your PDFs, and you can add or remove PDFs as required.
By using the Retrieval-Augmented Generation (RAG) techniques, Copilot ensures that your responses are accurate and free from hallucinations and biases.
This feature will enable you to analyze reports, whitepapers, and documents to gain valuable insights buried deep inside them without the need for manual sifting through the entire document.
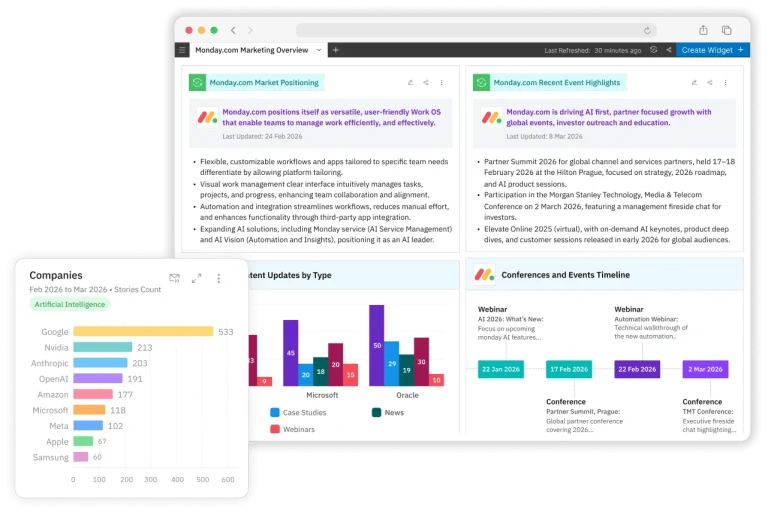
New in Newsfeeds: Consolidated summary from multiple updates
In Contify Newsfeeds, you already have the option to generate key highlights and extract quotes from any story that you like. We’ve now upgraded this capability.
You can now select multiple updates on Contify Newsfeeds and generate a consolidated summary from all of them at once. This feature will enable you to generate executive summaries and briefing reports encompassing multiple market and competitor updates in seconds.
You can also customize the prompts for generating title and summary to get the output that satisfies your requirements.
This new capability not only saves you valuable time but also enhances the efficiency and impact of your intelligence deliverables.
New in Dashboard Widgets: Bubble & Region coverage chart types
We’ve added two new chart types to our Dashboard—Bubble and Region coverage charts. These can display multiple data points and make evaluating their relationships easier.
Bubble Chart
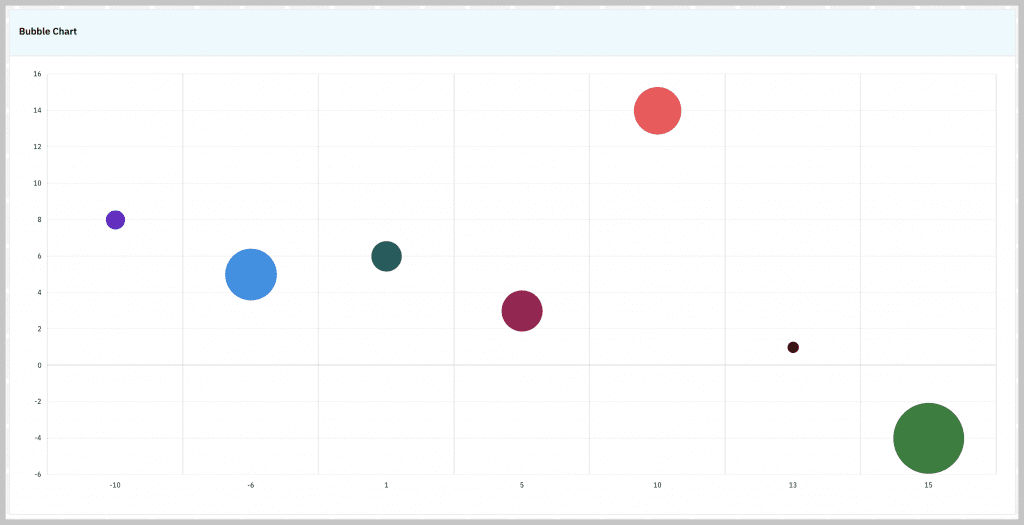
Bubble Chart is perfect for comparing and analyzing complex data sets, such as market segments, financial performance, and project metrics, in a compact and visually appealing way.
Region Coverage Chart
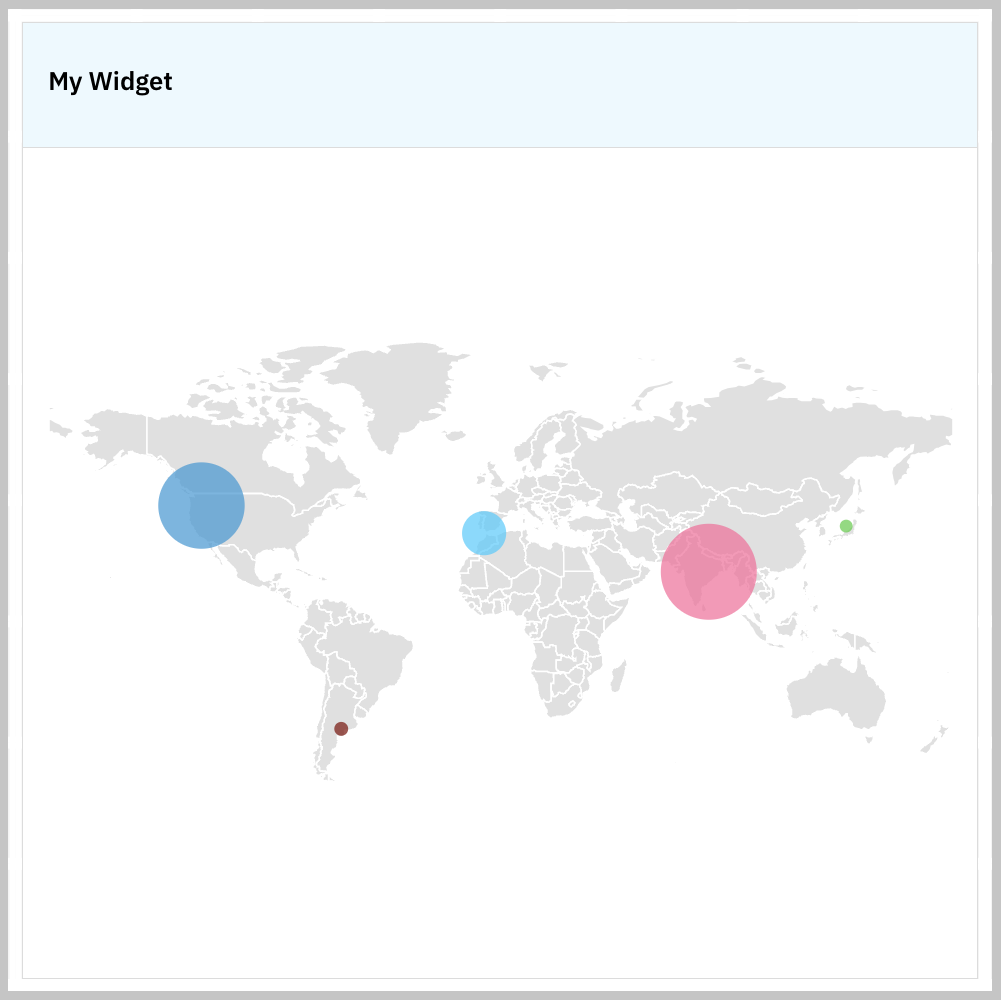
Region coverage chart will help visualize geographical data with ease. It’s ideal for mapping out regional distributions, tracking market presence, and identifying geographical trends in a visually appealing manner.
Insights update: Enhanced reference management
In Contify Insights module, you can now modify the references of KIQ responses by adding new ones or unlinking existing ones. Based on these modifications, you will receive updated insights contextual to your KIQ, ensuring they reflect the most current information.
Additionally, you can now include external URLs as references, allowing for a wider variety of sources to be included. This extends the previous functionality, which lets you add updates and insights to the Contify platform via URLs.
Newsfeeds update: Open access to Key Highlights and Quotes
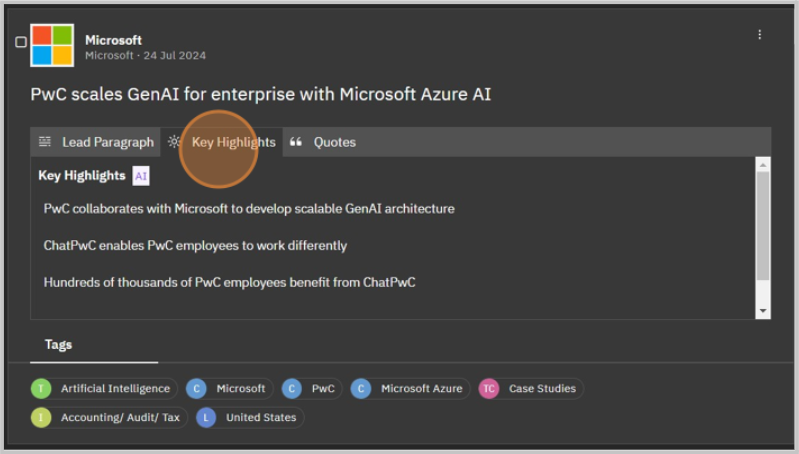
In Contify Newsfeeds module, the Key Highlights and Quotes tab is now visible to all users by default, and no additional permissions are required. This update makes it easier for all platform users to access concise information instantly and easily without barriers.
Ready to see Contify’s updated capabilities in action?
Try out our 7-day free trial for a hands-on experience of our latest features.
That’s all for now. Stay tuned for more updates.