 Written By:
Team Contify
Written By:
Team Contify

Overview
Manually extracting factual data and deriving insights from unstructured text, such as news articles, press announcements, and other documents, is time-consuming. It leads to delays, errors, and gaps in the data coverage while extracting information.
Large language models (LLMs) like GenAI hold immense promise for automating such tasks. However, these technologies are still not flawless and come with inherent limitations, such as:
• Hallucinations: Sometimes generate text entirely fabricated or irrelevant to the input.
• Inaccuracy: Facts and information presented may not always be accurate and are difficult to audit or verify.
• Biases: LLMs are trained on massive amounts of data, which can be biased or contain factual errors.
Due to these limitations, GenAI needs guardrails before it is deployed in decision-making applications.
This is where Contify’s new feature, “Insights,” comes in. Contify Insights leverages GenAI’s capabilities for text processing and principles of Knowledge Graphs for data storage and analysis to address the above-mentioned limitations.
In this blog, we’ll discuss how Contify uses these complementary technologies, GenAI and Knowledge Graphs, to extract factual data and generate reliable Insights from unstructured text.
The Road to Contify Insights
Contify Insights was developed after over a decade of efforts to make sense of unstructured text. This level of analysis was previously unattainable before the advent of large language models. Here is a quick overview of the journey that led to the creation of Contify Insights.
In the early days of information management systems, data was organized in folders. The main issue with this approach is that real-world data doesn’t fit neatly into a simple parent-child structure, as the same information can belong to multiple categories. To overcome these limitations, Contify introduced a taxonomy-based Market and Competitive Intelligence (M&CI) platform.
Folders to Taxonomies
Taxonomies have played a vital role in the Contify platform, allowing it to systematically organize information by competitors, business units, intelligence topics, and stakeholders. This structured approach to data organization is essential for analyzing information, developing machine learning models for classification, and implementing advanced natural language processing for auto-tagging.
However, despite their advantages, taxonomies lack intelligence regarding the relationships between different tags. For example, while a company, location, and products or services can all be tags, taxonomies do not inherently connect this information. They do not understand that a company is a competitor, has its headquarters in a specific location, and offers competing products and services.
This limitation is where ontologies come into play, providing the necessary framework to connect and represent these relationships intelligently.
Taxonomies to Ontologies
An ontology acts as a blueprint or schema for your competitive landscape. It defines entities, such as companies and people, and their relationships. It serves as a formal representation of the competitive landscape, enabling software to do intelligent work by understanding the meaning of text.
For instance, an ontology for the competitive landscape includes entities like “competitors,” “executives,” and “customers.” It specifies that “funding” is an element of the landscape, with properties such as “value” and “purpose of funding.”.
By evolving from a taxonomy-based approach to an ontology-based platform, Contify Insights has developed software that can map the nuanced details of your competitive landscape and enable it to derive actionable insights.
However, an ontology is just a framework for consistently representing a competitive landscape. What about the actual competitive landscape? This is where Knowledge Graphs come in.
Using Ontologies to Build Knowledge Graph
A knowledge graph contains the actual data based on the ontology blueprint. It uses the entities and relationships defined in the ontology to represent specific instances of those entities. For instance, the ontology might define ‘Competitors’ as an entity related to another entity ‘Location’ with the relationship ‘Headquarters.’ In the knowledge graph, this translates to “Tesla” as the competitor entity and “Austin, Texas” as its headquarters. This interconnected data forms the knowledge graph of your competitive landscape.
Knowledge Graph of Your Competitive & Market Landscape
Contify Insights is the knowledge graph of your competitive landscape.
Contify Insights has detailed setup functionality, which you can use to develop an ontology of your competitive landscape. This ontology will be the basis for software that captures factual data from text and intelligently connects it to create your Knowledge Graph.
Using the interconnected data in the Knowledge Graph, Contify Insights analyzes a large volume of data to provide accurate responses to your intelligence questions.
For example, you want to know the new product features your competitor has introduced. It will automatically generate a precise response based on the question, reducing the need to skim through multiple articles manually.
Your Contify platform’s knowledge graph automatically grows as new information becomes available, continuously enriching the intelligence in your dashboards and reports.
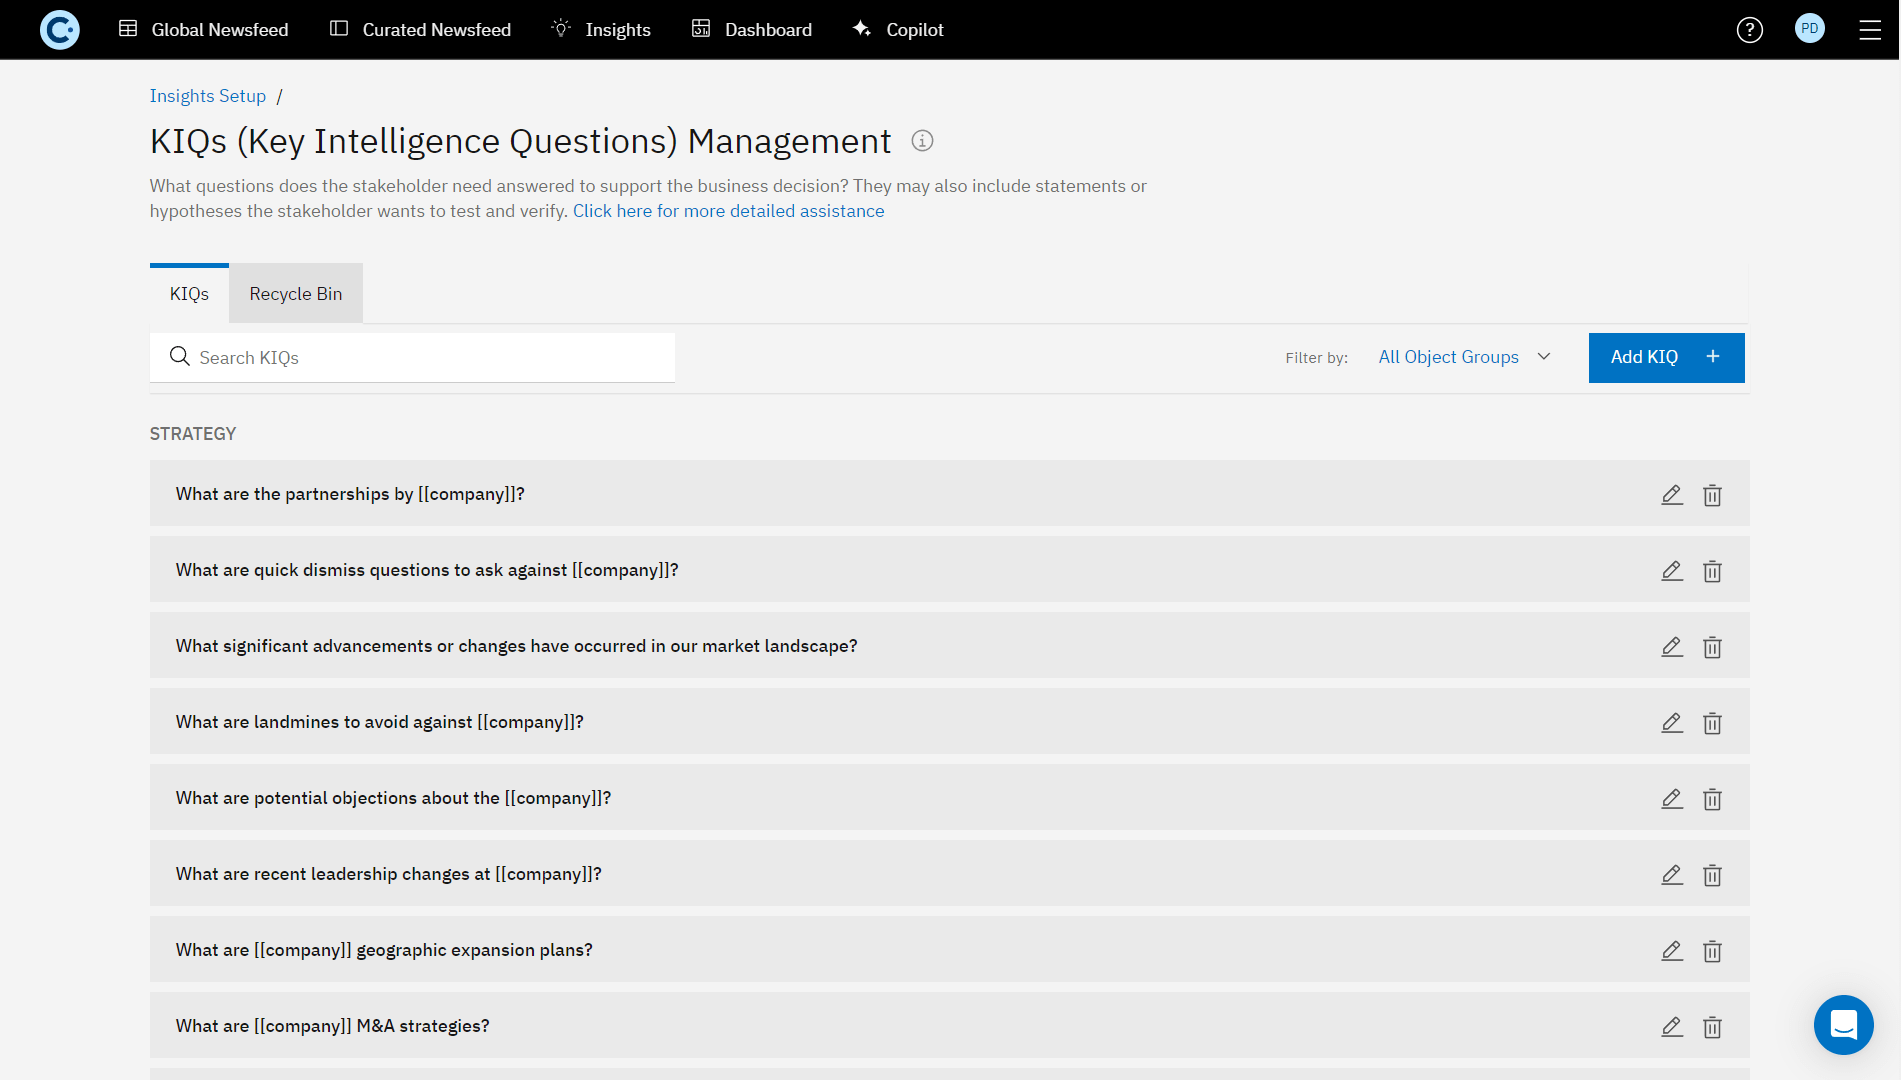
Foundation: Key Intelligence Questions (KIQs)
The success of your Market & Competitive Intelligence (M&CI) program depends on its alignment with your stakeholders’ strategic objectives. The key to achieving this alignment is translating their objectives into specific questions called Key Intelligence Questions (KIQs).
KIQs help to define what is important (intelligence), what topics and sources to monitor, and how to analyze and present intelligence. These questions make the Insights actionable.
Because answers to KIQs, called KIQ responses in Contify, are directly related to the questions your stakeholders need to answer.
KIQs are the central pillar of Contify Insights. The set-up (Ontology), extraction, and analysis of Facts to derive Insights are targeted to your stakeholders’ KIQs.
Contify Insights comes with a pre-configured list of suggested KIQs. Like everything else on the Contify platform, you have the flexibility to add your own KIQs and supplement the predefined list of KIQs.
Unique Features
Contify’s design principles recognize that M&CI requirements differ based on each organization’s unique situation. Therefore, the platform must be highly customizable and can be tailored to meet the requirements of various organizations and functions.
Following these principles, Contify Insights is designed to adapt to the unique situation of your organization. Leveraging GenAI to capture the context of information and create Knowledge Graphs which enables several unique features on the platform. For example,
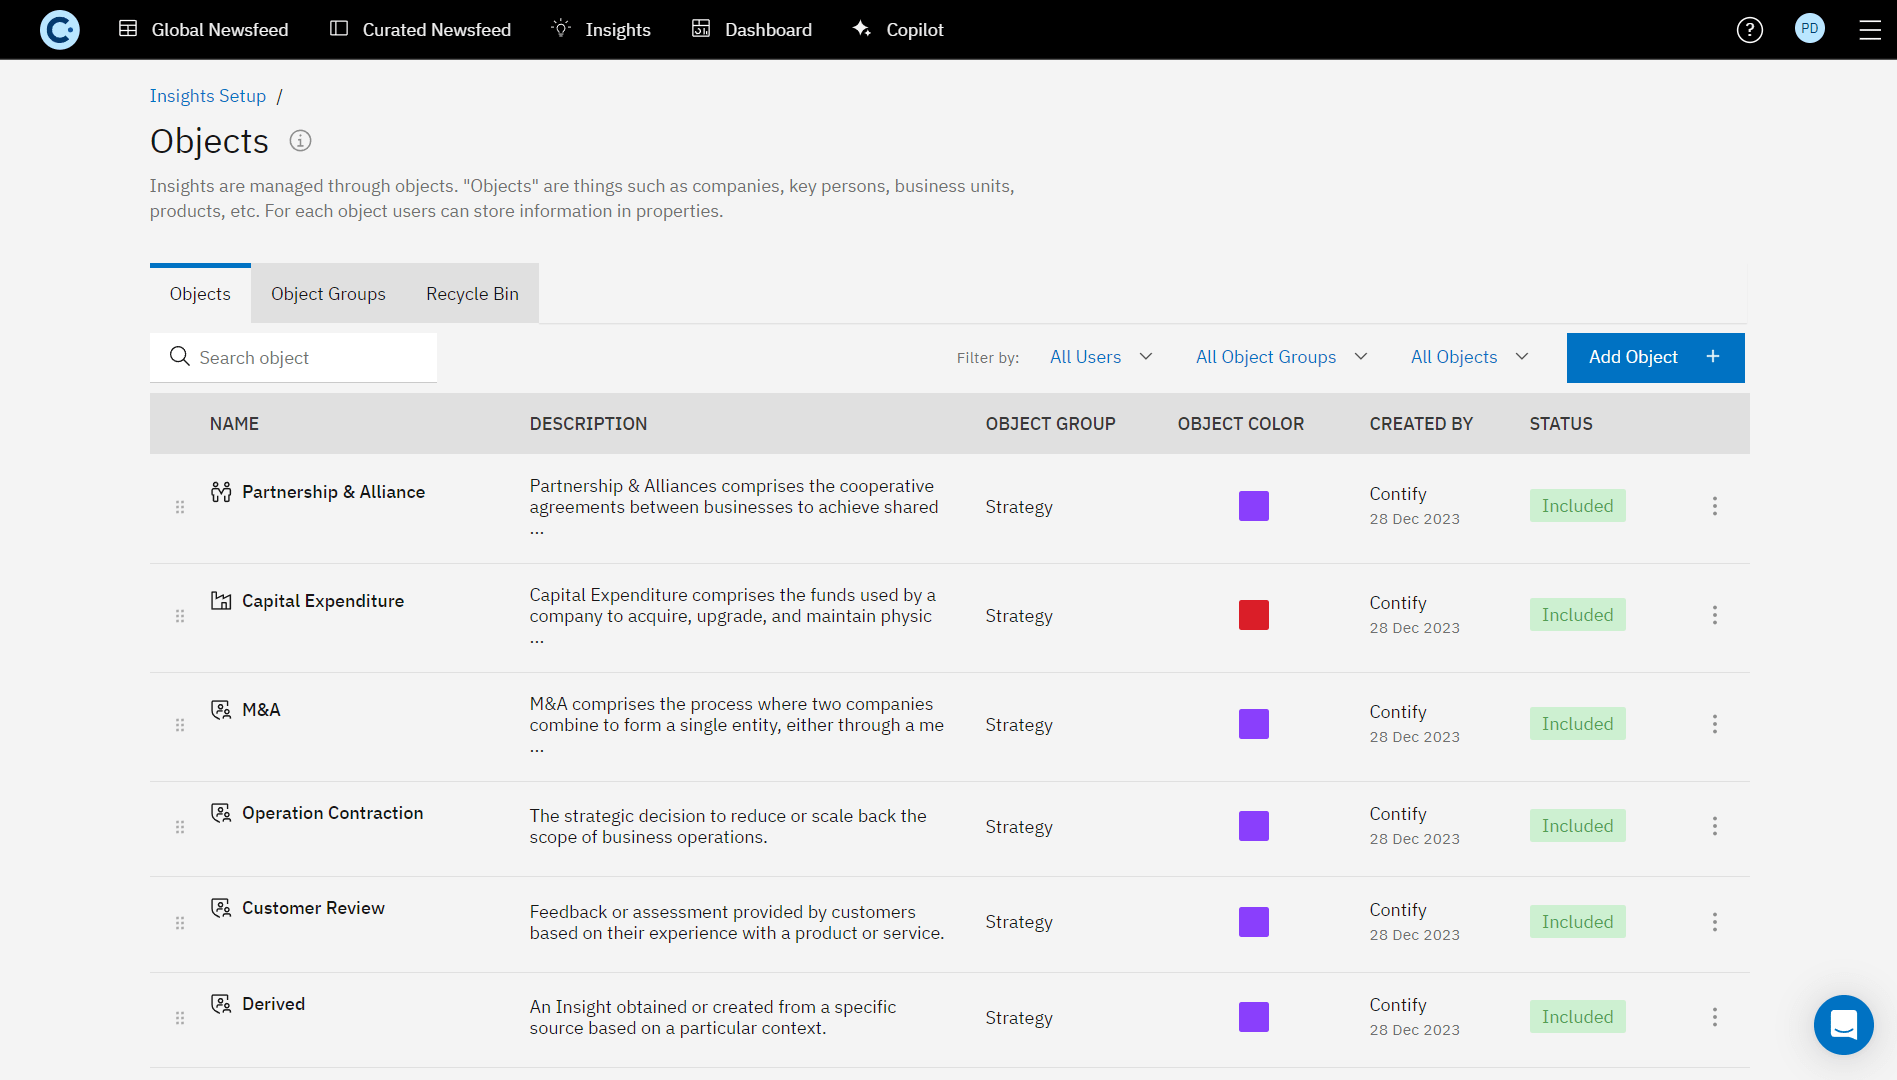
Custom Objects and Fields (Ontology)
Contify Insights’ ontology comes with a preconfigured system of ‘Objects’ and ‘Fields.’ Objects are entities such as Competitors, Executives, Customers, Products, etc., and associated business events such as Partnerships, Funding, M&A, etc. Fields are properties of these objects.
These objects and fields are akin to nodes and properties in the Knowledge Graph.
Like other features on the platform, you can customize Objects and Fields. This is crucial for capturing data points unique to your M&CI needs and unavailable in a preconfigured system. For instance, you can create a custom object for ‘Hirings’ and capture related data points such as the number of employees, locations, skills, etc.
Custom Prompts
In Contify Insights, GenAI applications include generating summaries, extracting factual information from text, analyzing facts to derive insights, and more. These functions are driven by a system of prompts, which act as instructions guiding the GenAI in performing specific intelligence tasks.
Custom prompts in Contify Insights enhance GenAI’s application by allowing you to refine summaries, extract precise factual information, and analyze data for actionable insights.
This flexibility ensures that the platform meets the unique M&CI needs of your stakeholders, providing them with highly relevant and valuable intelligence.
Fact Cards
Contify Insights automates the extraction and analysis of data from unstructured texts, such as news articles, press releases, and announcements, organizing it into a structured format based on relevant objects and fields.
The extracted and analyzed data is then organized in Fact Cards based on predefined objects and their fields. For example, information about a company’s new product launch would be categorized under the ‘New Offerings’ object, with specific details such as product name, launch date, and features captured in relevant fields.
![]()
Contify Insights uses GenAI and custom-developed natural language processing (NLP) techniques to scan through unstructured text and pinpoint key information. Whether it’s details about a company, its executives, recent mergers, or product launches, it efficiently extracts relevant data from large volumes of text. This capability ensures that relevant information is identified and processed without manual intervention.
This process enhances the accuracy and depth of your market and competitive intelligence.
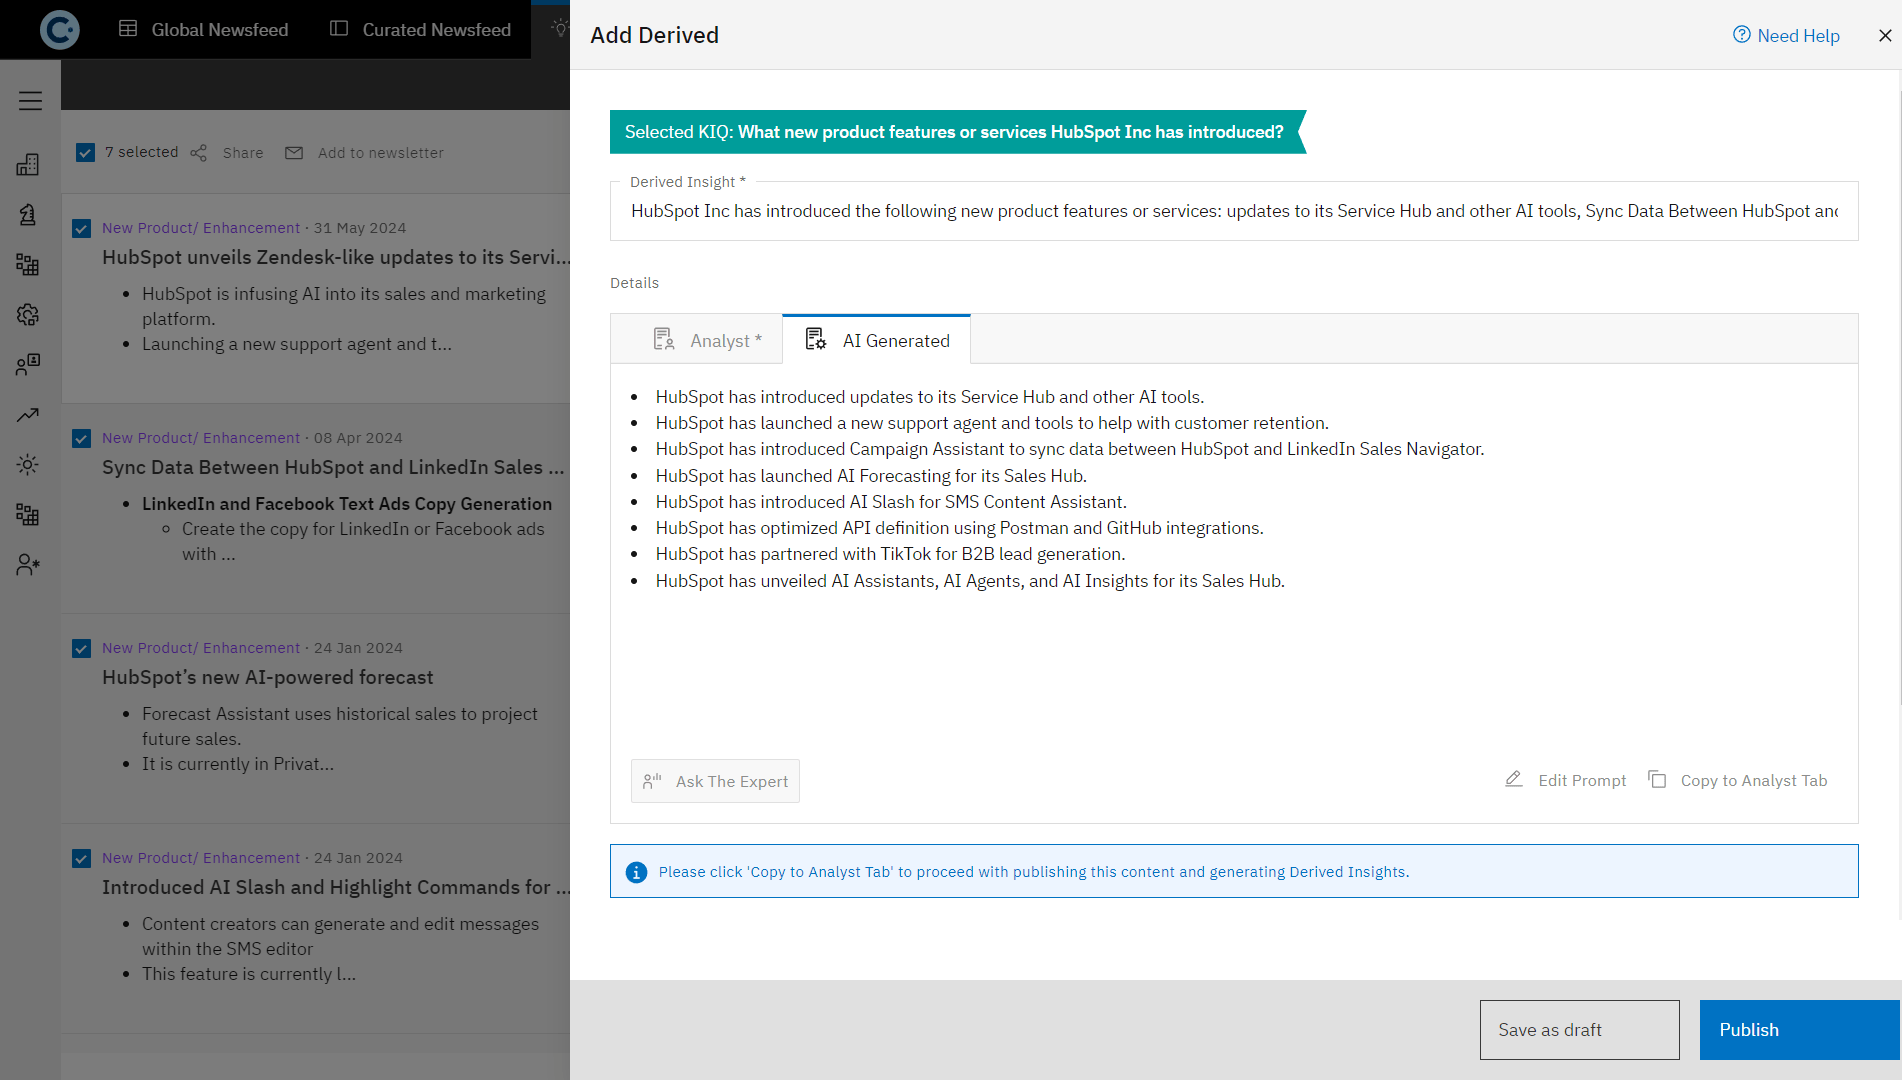
KIQ Responses
KIQ responses allows you to transform data into qualitative analysis, providing answers to Key Intelligence Questions (KIQs). They provide targeted answers to your stakeholders’ KIQs to help them make informed decisions based on facts.
A KIQ responses can be created using a single fact card or combining multiple fact cards to provide a more comprehensive perspective. Each KIQ response is linked to the related fact cards as a reference.
By grounding KIQ responses in concrete fact cards, Contify ensures that the insights are traceable back to the original data sources, providing accurate attribution, avoiding the common issue of AI-generated hallucinations, and enhancing the credibility of the analysis.
You have complete flexibility to refine the KIQ responses by customizing underlying prompts, ensuring they remain relevant and accurate as new information becomes available or your analytical needs evolve.
Copilot
A conversational interface for you to receive instant and accurate answers to your ad-hoc intelligence questions.
Unlike other AI chatbots or copilots that are heavily dependent on LLMs, Contify Copilot leverages the Insights’ Knowledge Graph and uses the RAG (Retrieval-Augmented Generation) technique to generate answers from reliable information, ensuring accuracy, precision, and trust. It is like a research analyst, providing accurate and reliable strategic intelligence.
Copilot retrieves relevant contextual data from the Insights Knowledge Graph based on the query, combines it with additional context, and generates an informed response. You can leverage its capabilities to answer important questions such as:
What are the current partnership strategies used by ____?
What are the recent actions taken by ____ to accelerate growth?
What new product features or services has ____ introduced?
Auto-Updating Dashboards
Auto-updating dashboards in Contify Insights provide a dynamic and real-time view of your competitive landscape. Contify transforms unstructured information into structured data using Fact Cards. This structured data is then analyzed to uncover trends, patterns, and qualitative insights, offering a deeper understanding of the competitive environment.
You can add this analysis to your Contify Dashboards as auto-updating widgets. These widgets continuously refresh with the latest data, ensuring that your dashboards always reflect the most current information and insights.
For example, you can generate auto-updating summaries of complex data and present them as timeline dashboards. These timelines make consuming and understanding information in a structured, chronological format easy. Similarly, you can create auto-updating timelines for significant events such as partnerships, new product launches, funding rounds, and other critical occurrences.
Designed to update automatically whenever new information becomes available, these dashboards ensure that you and your stakeholders always have access to the latest intelligence without the need for manual intervention.
Visually Explorer Your Competitive Landscape (Knowledge Graph)
With Knowledge Graph Explorer, you can visually explore your competitive landscape, uncovering hidden connections and gaining new insights. These visualizations are continuously updated with the latest data, ensuring your insights remain current and accurate.
By visualizing your competitive landscape, your stakeholders can identify relationships and connections that might not be immediately apparent through traditional analysis. This includes discovering links between companies, key executives, and strategic movements.
For example, you might find several competitors forming partnerships with the same technology provider, indicating a potential trend or shift in offerings by your competitors.
Your competitive landscape can be visualized and explored by all stakeholders in the organization, promoting a consistent and unified view of the market. This collaborative and interactive approach ensures that all stakeholders have a consistent and up-to-date view of the market, supporting informed and strategic decision-making across the organization.
Conclusion: Single Source of Truth
The most significant advantage of Contify Insights, a knowledge graph-based intelligence feature, is that it serves as a single source of truth for decision-making. It creates a shared understanding of the competitive landscape, facilitating consistent interpretation and intelligence sharing across different teams and stakeholders.
Contify Insights promotes unity and collaboration by providing a common vocabulary, which reduces misunderstandings and miscommunications. It integrates information from external and internal sources, offering a unified framework. This ensures that everyone in your organization, from executives to analysts, works from the same market knowledge, enabling a cohesive team and ensuring consistent interpretation of the competitive landscape.
Contify Insights focuses on establishing a shared understanding of the market and competitive landscape, serving as the single source of truth for the entire organization. This common framework minimizes misunderstandings, integrates diverse information, and enhances decision-making processes.
Ready to explore it? Get in touch with us to book a free trial!


